When debugging the Bot Framework it is trivial to debug if you are developing in C#. It was bit of pain for me to do the same is node, as JavaScript is not my everyday language. But, after researching googling about this, I can say that it is really easy in node as well.
Below are the version details that I tried this on:
- node: 8.1.2
- npm: 5.0.3
- OS: Windows 10
- Chrome: Canary 61.0.3137.0
- Bot Framework Emulator: 3.5.29
Below is my package.json for a simple “Hello World” bot.
{
  "name": "echo-bot",
  "version": "0.1.0",
  "license": "MIT",
  "description": "Echo bot example",
  "scripts": {
    "start": "node --inspect app.js",
    "test": "echo \"Error: no test specified\" && exit 1"
  },
  "dependencies": {
    "botbuilder": "^3.8.4",
    "dotenv": "^4.0.0",
    "restify": "^4.3.0"
  }
}
Since I am developing this in Visual Studio Code, this is my tasks.json
{
    // Use IntelliSense to learn about possible Node.js debug attributes.
    // Hover to view descriptions of existing attributes.
    // For more information, visit: https://go.microsoft.com/fwlink/?linkid=830387
    "version": "0.2.0",
    "configurations": [
        {
            "type": "node",
            "request": "launch",
            "cwd": "${workspaceRoot}",
            "runtimeExecutable": "npm",
            "runtimeArgs": [
                "start"
            ],
            "name": "Launch Program"
        }
    ]
}
Now, to run the bot application in VSCode using Ctrl+F5 or typing “npm start” in the command prompt.
To debug the bot in Chrome DevTools, type “chrome://inspect/#devices“. Then click the “Open dedicated DevTools for Node” link. The page should be like this once you do this.
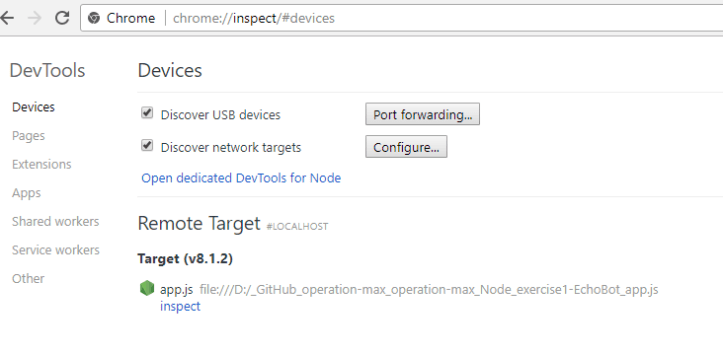
Chrome will now display the node application that it can detect in the Remote Target area. Click in the inspect link to open the DevTools. Now, set your breakpoint and use the emulator to send a message.
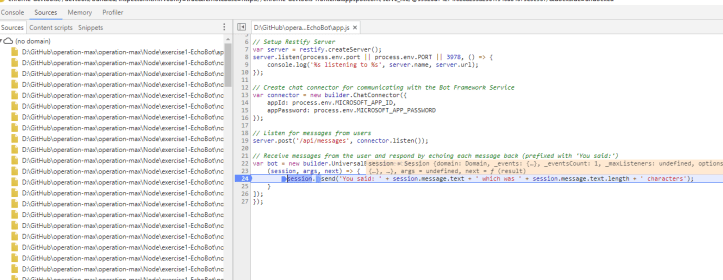
In the screenshot above you can see that I am already debugging using Chrome DevTools and debugger is waiting in the breakpoint that I set.
Reference:
https://nodejs.org/en/docs/inspector/
